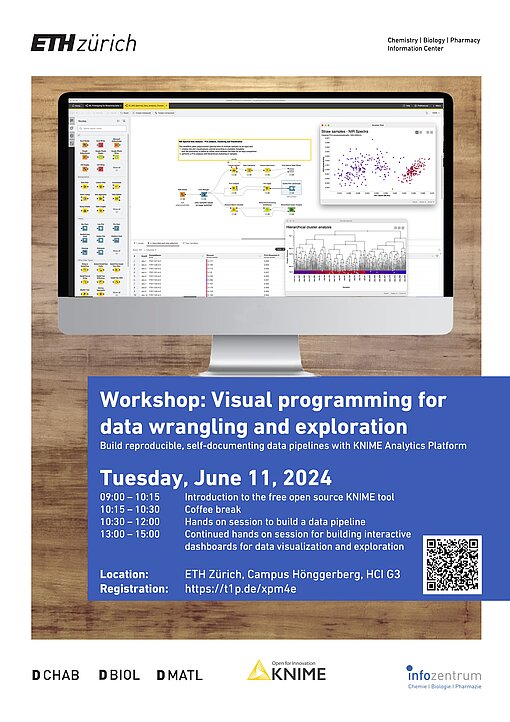
Workshop: Visual programming for data wrangling and exploration with KNIME
News
Join us June 11, 2024, for the KNIME workshop to learn how to leverage your data analysis using our free open source tool KNIME.
In this course we will teach you how to build reproducible and self-documenting data pipelines to manipulate and visualize data using KNIME Analytics Platform (AP). KNIME AP is an open source visual programming tool that's free of charge and available for everyone. We will work on an example of malaria HTS data, and cover how to import data from different sources and formats (including chemical data), go through the most common and useful data manipulation operations, and visualize the data in an interactive way.
Besides that we will show you how to programmatically retrieve data from web services, and if time allows how to integrate Python or R code into your pipeline. Please note that active participation works best with a laptop. Please come with KNIME AP preinstalled from https://www.knime.com/downloads, so we can start right away and also do not forget to register at t1p.de/xpm4e.
The workshop will be given by KNIME experts, Dr. Alice Krebs and Dr. Gregory Landrum.
Agenda: |
|
09:00 – 10:15 | Introduction to the free open source KNIME tool |
10:15 – 10:30 | Coffee break |
10:30 – 12:00 | Hands on session to build a data pipeline |
| - Import and manipulate HTS assay and chemical data |
| - Retrieve data programmatically from web services |
| - Data manipulation (aggregation, missing value handling, etc.) | |
| 12:00 – 13:00 | Lunch break |
| 13:00 – 15:00 | Continued hands on session |
| - Build interactive dashboards for data visualization and exploration |
| - Parameterization |
Ort: | ETH Zürich, Campus Hönggerberg, HCI G 3 |
| Published: |
|---|
